
卡斯:8月份卡车整车运价上涨11%,货运量转为正值
卡萨货运指数数据显示,8月份卡车整车干线运输费率同比大幅攀升,货运量在连续42个月下滑后终于迎来积极拐点。文章:卡萨:整车运输费率在……月份飙升11%
Truckload linehaul rates surged again in August while shipment counts turned positive for the first time in three and a half years, according to data from Cass Information Systems.
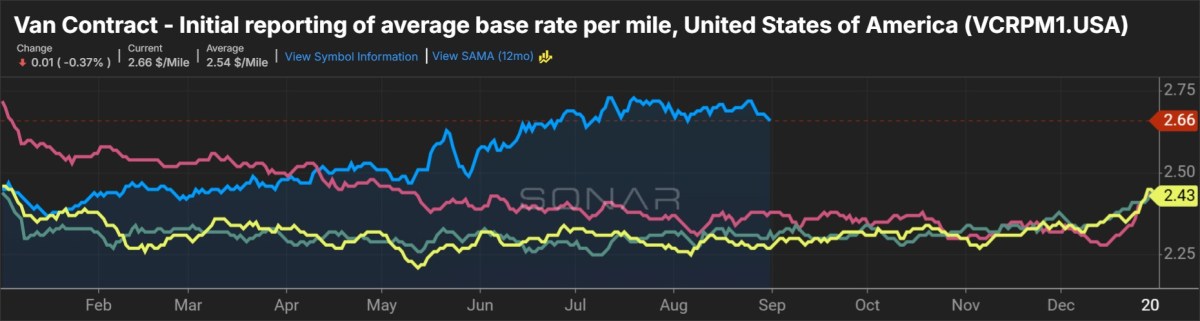
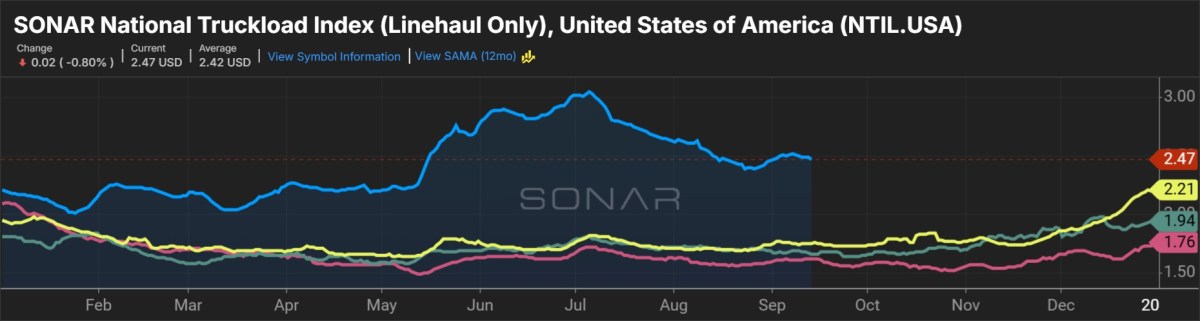
Cass’ TL linehaul index, which tracks rates excluding fuel and accessorial surcharges, jumped 11.3% year over year during the month. The index was up 70 basis points from July. August marked 20 consecutive y/y increases and the largest since June 2022.
The linehaul index includes for-hire spot rates but is historically heavily weighted to contract rates.
“The sequential increase is in line with expectations and as indicated by the spot market,” the Monday report said. “Even as spot rates slow with modest sequential declines, the much larger contract market is adjusting higher.”
Freight shipments recorded by Cass (NASDAQ: CASS) increased 2.1% y/y, which was the first y/y increase after 42 months of declines. Shipments were 5.6% higher sequentially in August (up 5% seasonally adjusted).
All domestic transportation modes are included in the index, but TL accounts for over 50% of shipments, with less-than-truckload representing approximately 25%. Road-to-rail conversion has weighed on the trucking-centric dataset in recent months as fuel prices have surged.
If normal seasonal shipping patterns hold through September, the index would increase approximately 1% y/y, the report said.
| August 2026 | y/y | 2-year | m/m | m/m (SA) |
| Shipments | 2.1% | -7.4% | 5.6% | 5.0% |
| Expenditures | 18.7% | 18.3% | 5.8% | 6.0% |
| TL Linehaul Index | 11.3% | 12.6% | 0.7% | NM |
Cass’ expenditures index, which measures total freight spend including fuel, surged 18.7% y/y in August and was up 5.8% from July (plus-6% seasonally adjusted). The positive y/y inflection in shipments drove the dataset higher, along with higher diesel prices (up 46% y/y and 10% sequentially).
Citing elevated risks to consumer spending, the report calls for tepid freight demand moving forward.
“With economic growth strong even amid a soft job market, and a restock likely beginning with ocean volumes rising and tariff refunds happening, the bottom is probably in,” the report said. “While likely modest, freight growth should continue.”
Data used in the indexes comes from freight bills paid by Cass, a provider of payment management solutions. Cass processes $37 billion in freight payables annually on behalf of customers.
Why it matters? August data from Cass Information Systems highlights a continued escalation in TL contract rates even as demand remains cool. The dataset confirms the impact strict regulatory enforcement is having on non-compliant capacity.
More FreightWaves articles by Todd Maiden:
- Hub Group warns of Nasdaq delisting notice; flags H1 operating loss
- ArcBest sees tonnage growth accelerate in August; raises Q3 asset-light guide
- XPO’s August metrics align with Q3 guidance
The post Cass: TL rates jump 11% in August, freight shipments turn positive appeared first on FreightWaves.